
“Managing the inevitable, avoiding the unmanageable”: climate change is already a reality and we must now adapt and live with extreme weather events, of course without forgetting to mitigate the causes so that they become unmanageable. Therefore, talking about greenhouse gases is no longer enough, how to eliminate fossil fuels and how to increase the use of renewable energy. We must plant trees and stop deforestation, but also learn how to behave when the weather shows the worst of us.
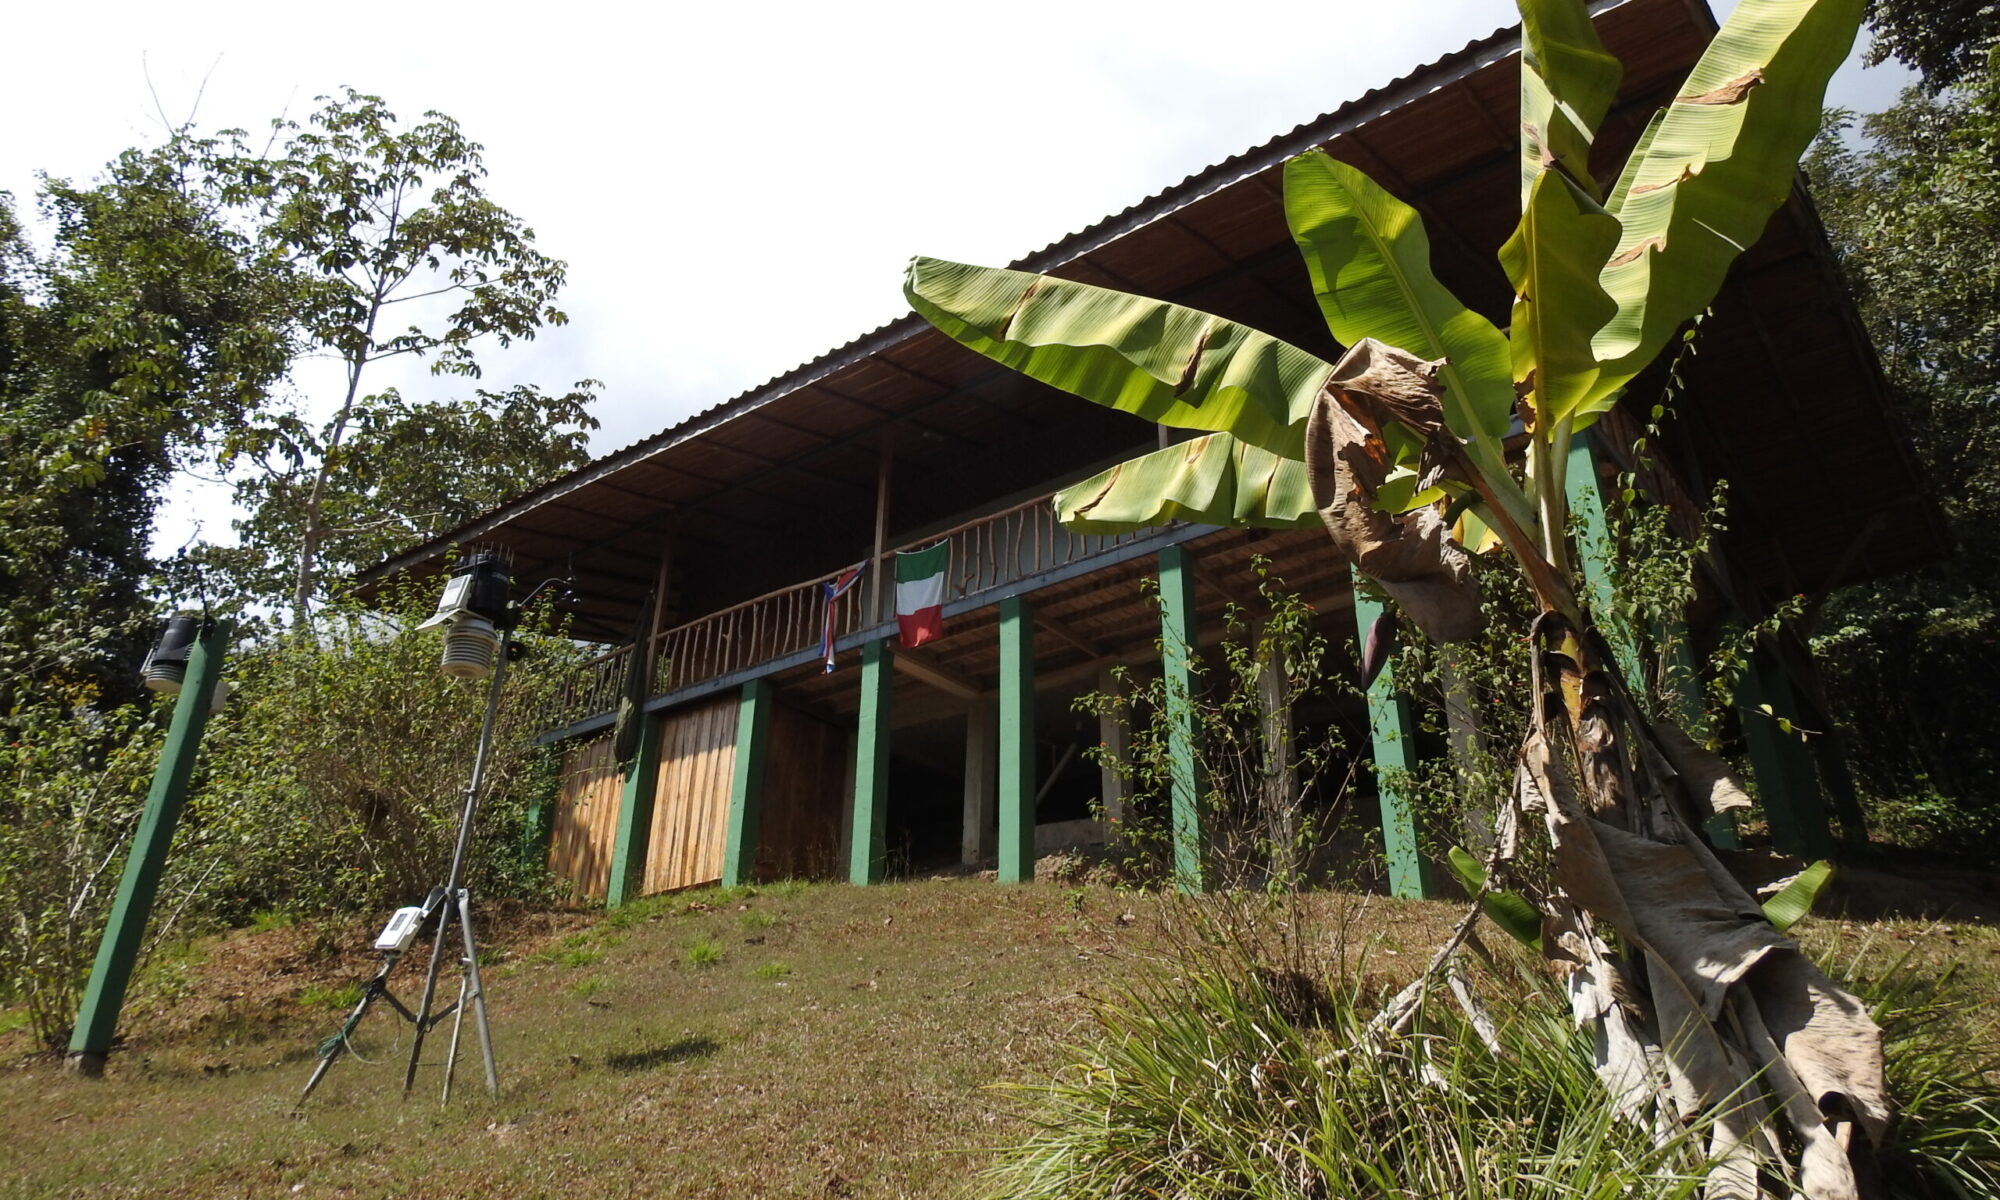
Climate at the Karen Mogensen Reserve
The climate of the area where the “Italia Costa Rica” Station is located is obviously tropical, hot and humid with high rainfall (but lower than in other areas of Costa Rica).
More in detail, the climate is affected by the classic tropical circulation of the trade winds, but in the area, due to the orography of Central America and factors of general circulation of the atmosphere, winds tend to occur mainly from the southeast. Complicating the local effects is the complex orography of the continental part of Costa Rica, which features mountains and active volcanoes (Volcano Poas, Turrialba, Irazu and others at lower altitudes such as Tenorio and Arenal) that exceed 3,000 meters, up to 3820 meters of the Cerro Chirripo.
The rainfall in the area, obtained from the climate atlas of the National Institute of Meteorology of Costa Rica, is about 2,200 mm of rain per year and is mainly linked to convective phenomena, with a rainfall regime characterized by a rainy season from May to November and a dry season (with precipitation not entirely absent) from December to April. During the rainy season, rainfall gradually increases up to about 400 mm on average per month in October, statistically the wettest. In July there is a temporary, relative decrease in rainfall for the so-called veranillo, a period of decline in rainy activity during the rainy season.
Average annual temperatures are close to 25 ° C, oscillating between 20 ° C of minimum temperatures and 30 ° C of maximum temperatures, lower thanks also to the hilly altitude of the nearby coastal areas. The area is one of the sunniest in Costa Rica (about 6-7 average hours of actual sunshine per day). The activity of tropical cyclones (potentially risky season from 1 June to 30 November) is not particularly frequent in the area and generally also in Costa Rica, although there have been in the past episodes in which tropical storms or hurricanes have influenced or even caused damage in some coastal areas of Costa Rica.
Just during a scientific expedition to the Station, the CLIMBIO 2016 campaign, hurricane Otto passed through Costa Rica and also the Reserve on November 24, 2016, causing considerable damage in the north of the country and also affecting the program of the scientific expedition. Fortunately, however, there was no damage to the station, and the webcam, which had been operational for a few days at the time, resumed the dynamics of the clouds as hurricane eight passed.
Costa Rica and the geographic area, of course, are also affected by global climate change, which adds to the effects of deforestation (and reforestation) that heavily affect the microclimate (more information here and here).
The weather instrumentation installed at the Italy Costa Rica Station has been operational since 2017, so so far the available data are not of a sufficiently long period. In fact, at least 30 years of continuous measures are needed to define the climate in detail and to highlight its changes.
To obtain a first reconstruction of the local climate, re-analysis data on the grid point (12 × 12 km) closest to the locality for a period of 30 years (from 1985 to 2018) were requested and kindly obtained from Meteoblue.
The first analyses are interesting and show that it would be appropriate to continue the elaboration of the vast data set and continue the observation activities. In particular, the daily observations of 2017 appear to be in good agreement with the re-analysis data regarding the daily minimum and maximum temperatures. Greater discrepancies between observation and re-analysis models instead emerge in the precipitation data. This is probably due to the convective nature of the phenomena, and confirms the importance of having instrumental observational data, foundations for validating and initializing models.
The long-term trend, over a period of 30 years available, highlights an increase in temperatures in accordance with the global climate changes underway, as well as an interesting correlation with the cyclical phenomenon of El Niño. The climatic classification of the area confirms a type of tropical climate, with an almost constant trend in temperatures throughout the year, mainly influenced by the seasonal cyclicality of the rains. Precipitation, abundant as is typical of humid tropical areas, has a dry season between December and early April and a rainy season from mid-April to November.
The average annual temperature is estimated at 25.4 ° C and the average annual rainfall amounts to about 2254 mm; these climatological estimates were obtained from Meteoblue Re-analysis.
The instrumental observational data collected so far, although only 4 years old, are in good agreement with the climatology from re-analysis as regards the temperature, which in the period 2017-2020 finds an average annual value of 25.7 ° C. The average rainfall 2017-2020 instead is 1939.4 mm, lower than the climatology from Re-analysis.
Continuing the measurements in the future is therefore important, the weather station installed with the CLIMBIO project, we hope, represents the foundations of a future centenary observatory such as that of the Geophysical Observatory of the DIEF in Modena, whose director of the period 1862-1892 Domenica Ragona stated: “We must be delighted with our contribution to the advantage of meteorology, because we will pass on to our posterity what our ancestors transmitted to us, that is, a myriad of observations and an immense copy of meteorological documents”.
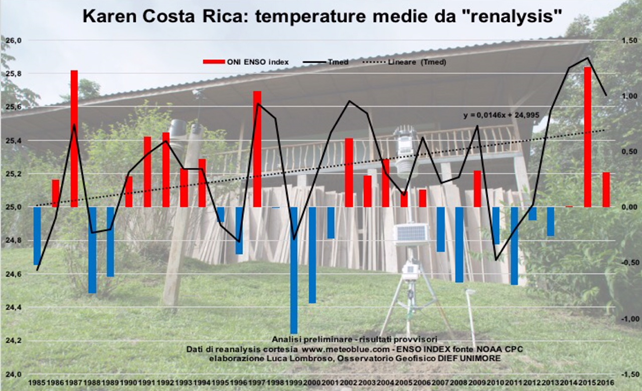
Time series of average annual temperatures from 1985 to 2017 obtained from Meteoblue Re-analysis, compared with El Niño (ONI Enso Index NOAA CPC). Preliminary processing. In the background of the graph, the “Italia Costa Rica” weather-climate and biological station at the Karen Mogensen Reserve.
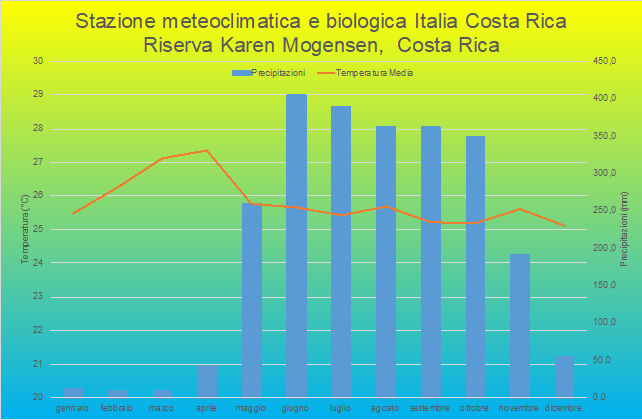
Trend of the 1985-2017 monthly average values of temperature and precipitation based on data from the Meteoblue reanalyses (www.meteoblue.com)